- Stronger Customer Relationships
- +1-949-878-7411
- ramana@varasi.com
Evaluating Portfolio of CRM Initiatives

A powerful visual tool to evaluate and organize a large number of CRM initiatives at your company, is a simple 2 x 2 grid. It guides you in prioritizing your initiatives.
Here is an example inspired by our business analysis for a client:
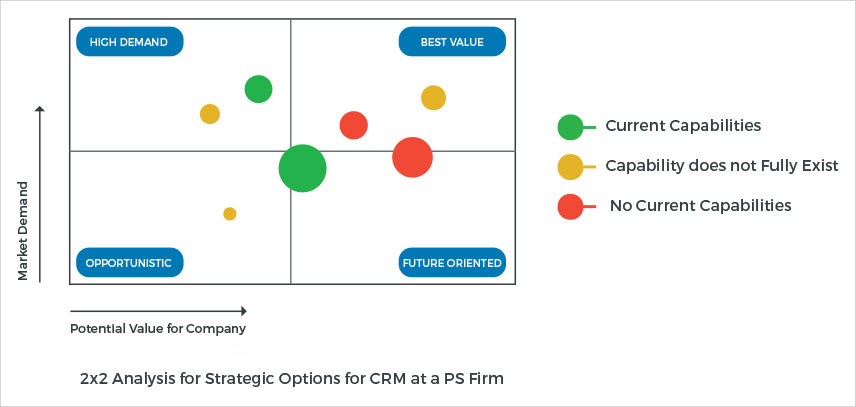
Each of the circles represents a CRM initiative that the organization could pursue. For this particular organization, the initiatives were along the lines of - building a customer database, creation of a deal desk for pursuing SMB customers, campaign management etc.
The initiatives in the Best Value box should typically be top priorities strategically, whereas those in the Future Oriented and High Demand boxes are those with potential and immediate benefits respectively. The initiatives in the Opportunistic box may be of low-risk but the firm would prefer to pursue initiatives that are in the other boxes if it has the capabilities.
Such a framework allows you to see the bigger picture for the impact on business when evaluating multiple options.
Some common parameters you can use as axes include:
- Strategic Fit
- Operational Impact
- Value for Organization
- Ease of Implementation
- Anticipated Revenue
- Strategic Significance
The strategic fit & significance are examples of parameters that evaluate initiatives based on how aligned an initiative is, to the strategic focus of the organization. For example, organizations may choose growth of current customer base as their strategic focus for the next few years; in which case, how aligned an initiative is, with respect to their ability to grow revenues from the current customer base indicates its Strategic Fit.
Similarly, ease of implementation is an example of a parameter that indicates whether a particular initiative can be completed with relatively manageable effort. Value for organization is a parameter that may indicate the anticipated benefit that an initiative brings.
The axes could change based on the context. You could also use size and color of the bubble that you plot for capturing two additional parameters in addition to the axes. In our example above, we color coded the bubbles to indicate the current capability of the organization to execute.
Ramana Metlapalli
Ramana is a Managing Principal at Varasi. Ramana is a lifelong learner and eternally curious about what goes into making some individuals and organizations, high performance ones. He writes about Business Analysis, Salesforce best practices and the world of Consulting.


